The purpose of the ABAP Call Monitor (transaction SCMON) is to monitor the execution (usage) of ABAP code (function modules, method calls etc.) in your productive system. The advantage of the SCMON compared to the UPL (Usage Procedure Logging in SAP Solution Manager) is that using this tool you not only collect the usage data (how often a specific ABAP object was called), but also the information about the calling business process. Therefore as a result of the monitoring, you get a list of business transactions (callers) along with all ABAP objects that have been called within these business transactions including the number of calls.
Since SCMON comes along with enhanced functionality scope compared with UPL, you can consider SCMON as a successor and use it instead of UPL.
In the example below you can see, that the function module HTTP_GET_HOST was called altogether 50 times and 19 times of it within the transaction SICF, 17 times as remote function call from the FB_AUINT_CLASSTEST_EXTERNAL and so on.
In the example below you can see, that the function module HTTP_GET_HOST was called altogether 50 times and 19 times of it within the transaction SICF, 17 times as remote function call from the FB_AUINT_CLASSTEST_EXTERNAL and so on.
ABAP Call Monitor does not provide any performance data.
You can use the collected data for example, to find all business processes that call a specific ABAP object (e.g.to identify the business processes affected by code change or deprecation) or to find out which ABAP objects are called by a specific business process.
SAP’s recommendation is to keep the monitor switched on for a certain period of time to get reliable data.
Prerequisites
ABAP Call Monitor is available with AS ABAP 7.50 and for the lower releases (>=7.00) per ST-PI Add-on.
The authorization profile for object S_ADMI_FCD with value SCMD for read access to ABAP Call Monitor data.
The authorization profile for object S_ADMI_FCD with value SCMA for administration activities in the ABAP Call Monitor.
Integration into SAP Solution Manager 7.20
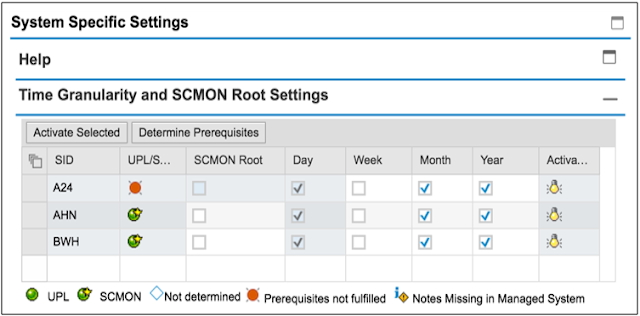
SCMON can be activated in different systems from one single place: SAP Solution Manager 7.20, if these systems are connected to SAP Solution Manager (Solman_Setup -> Custom Code Management).
Generally the Solution Manager 7.20 collects either UPL or SCMON data depending whether the connected system is capable of SCMON or UPL. It is also possible to extract the SCMON data into Solution Manager BW. The data will be stored in day slices and if needed as well in weekly, monthly and yearly aggregation. This will help to keep SCMON data during a long time period in one single place, but still keep the time slices and the respective data small in the original system itself. The existing already collected UPL data get also imported into Solution Manager BW and simply mixed with the new SCMON data.
The SCMON data can then be evaluated for decommissioning of unused objects in the connected systems, using Custom Code Lifecycle Management (CCLM) Decommissioning Cockpit in the Solution Manager. (Sm_Workcenter -> Custom Code Management -> Custom Code Management or CCLM Decomissioning Cockpit). Please consider that usage data are collected from different systems and if an object is not used on one system, but used on the other system, you should not decommission it.
Administrator: Configuring ABAP Call Monitor
System administrator configures SCMON and changes the data collection.
CAUTION:
◈ You should never run Usage Procedure Logging (UPL) und SCMON in parallel. This can happen coincidentally for example if you activate UPL via Solution Manager and then SCMON locally in ABAP system.
◈ Avoid using SCMON (or UPL) for the systems which already run under maximum load
It is the task of a system administrator to activate or deactivate monitoring with SCMON for the entire ABAP system (all server instances) by using the button Activate and then specifying the configuration settings:
Here you specify the point of time when the monitoring will be deactivated automatically (Scheduled Deactivation) and limit the maximum number of records that are created during monitoring (Record Limit).
The time slices in the ABAP Call Monitor make possible to analyze the progress of monitoring results over time. You then have the option to focus on monitoring data for a specific time interval. For example, you might be interested in those ABAP procedures that call development objects that have been declared as deprecated since a specific point of time (ABAP Call Monitor > Configure Time Slices).
Here you can limit the data records created during monitoring to a specific period of time. The ABAP Call Monitor automatically deletes the monitoring data that has been created before Maximum Number of days.
Usually, the data collection takes automatically place once an hour if the ABAP Call Monitor is active in the system. But you can trigger the data collection explicitly at any point of time (button Collect Data).
If you have finished your monitoring activities and no longer need the corresponding data, you have the option to explicitly delete the collected monitor data (menu ABAP Call Monitor > Delete Data).
Developer: Using ABAP Call Monitor for data analysis
Display and analyze the collected data
The Data Browser of the ABAP Call Monitor allows you to analyze the use/dependency relationship between called objects and calling business processes (button Display Data).
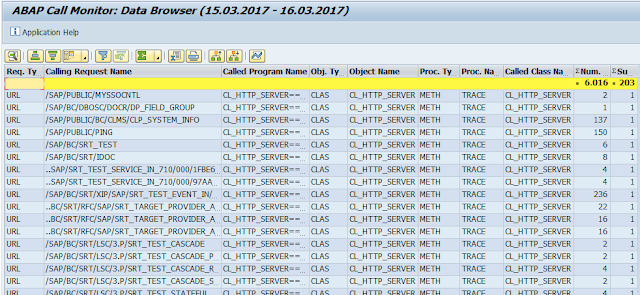
You can also specify the data for selective analysis. For example if you want to get all URLs calling the method TRACE of the class CL_HTTP_SERVER during a specific period of time, you need to specify the following options:
And here is the result example:
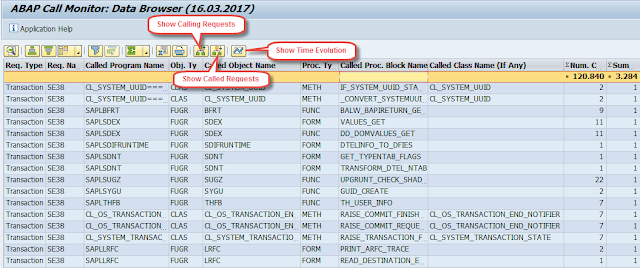
If you want to display all ABAP objects that were used (called) by the SE38 transaction within one day you need to specify the following options:
Based on the selection criteria, the ABAP Call Monitor generates a result list of request entry points along with all ABAP objects that have been executed within the selected time interval:
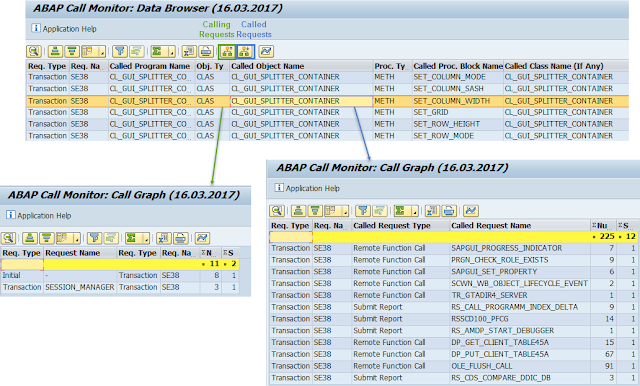
Each entry in the list represents a monitoring data record, which you can drill down for viewing further details. For example Show Time Evolution displays the daily time slices of monitoring data for the selected entry, Show Calling Requests displays the calling requests and Show Called Requests displays the called requests for the selected entry.
Display and analyze the Call Graph
The call graph option allows you to focus on the usage/dependency relationship between requests (button Display Call Graph). For example, if you want to know which objects call the transaction SE38 within a certain period of time, you will need to specify the following options:
And here is the result example:
Display Log
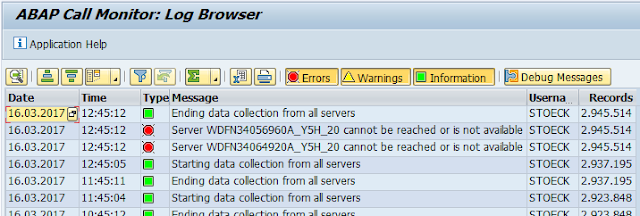
Occasionally, you will need an overview of all monitor activities within a certain period of time (button Display Log).
In the Log Browser screen that appears, you get a list of actions or events – such as activation or deactivation of the call monitor, deletion of records, and collection of data.








0 comments:
Post a Comment